The world's laziest trading strategy: Six years later
Do simplicity still wins? Plus, how a small change made a big impact
Back in 2019, I introduced what I called “The World’s Best (and Laziest) Trading Strategy”. It was simple: four trades a year. The idea? Use seasonal trends to make gains with minimal effort.
The plan was easy to follow: buy and hold at specific times, then sit back and let the seasons do the work.
The original strategy: Simple and straightforward
Here are the rules for the original strategy:
- Hold GLD (SPDR Gold Trust ETF) from December 20 of every year through February 20 of the following year, and during August.
- The rest of the time hold SPLV (Invesco S&P 500 Low Volatility ETF)
Before checking the latest results, let’s review how the strategy performed historically.

As you can see, over the years, it showed promising results by balancing gold’s seasonal strength with the market’s general upward trend.
Do simplicity still wins?
I wanted to see if these patterns would hold up over time, so I ran the numbers.
Here’s what I found:
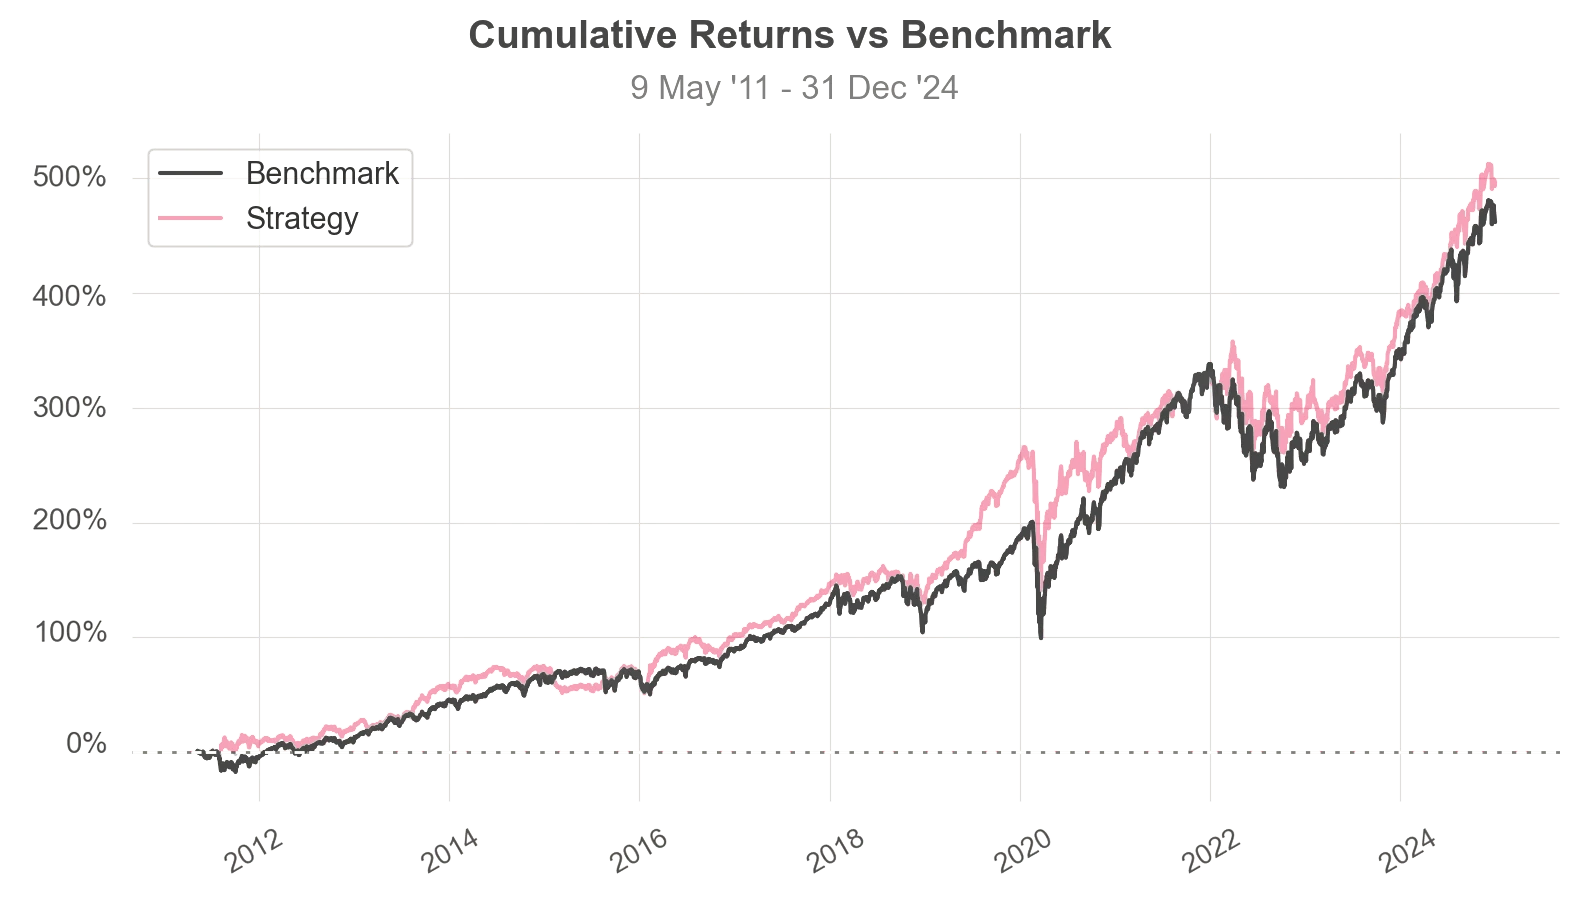
Starategy Performace: 2011 to 2024
- Total Return: 381.6% (SPY: 459.64%)
- Average Annual Return: 8.27% (SPY: 9.1%)
- Sharpe Ratio: 0.85 (SPY: 0.82)
- Max Drawdown: -35.88% (SPY: -33.72%)
The Sharpe ratio measures risk-adjusted returns—higher is better.
Max drawdown shows the largest drop from peak to bottom—a key risk measure.
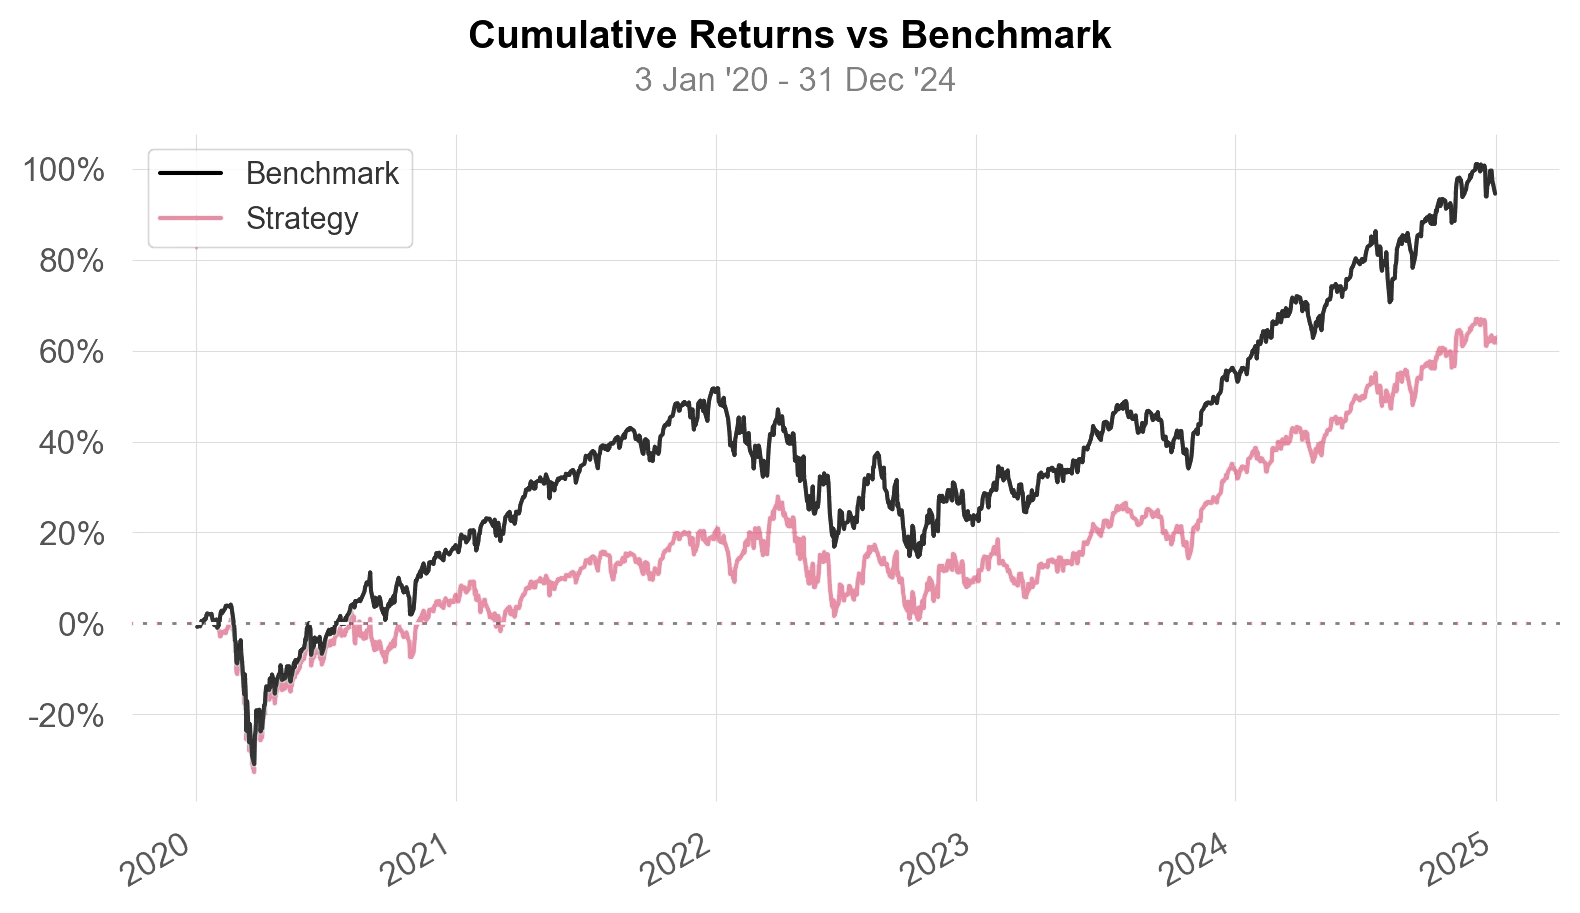
The numbers tell a story. The strategy worked but lagged behind SPY. What caused this underperformance?
Possible Reasons for Underperformance
Several factors may have hurt the strategy after 2020:
- The COVID-19 Crash: Market chaos disrupted typical patterns.
- Post-Pandemic Bull Run: The rapid rise in stocks broke the seasonal trends.
- Shifting Market Behavior: Patterns that worked for years started to weaken.
Even though the strategy recovered, it couldn’t match SPY’s fast growth. So, how could we adjust it for changing markets?
Tweaking the Strategy: Adding a VIX-Based Rule
Rather than abandon the strategy, I refined it. I added a simple rule using the VIX (volatility index)—a measure of market fear.
How it works:
- Keep GOLD during the usual seasonal periods.
- Switch between SPLV and SPY based on the VIX average from the past month:
- VIX above 21 (suggests high volatility): Hold SPLV.
- VIX below 21 (suggests low volatility): Hold SPY.
[Suggested Image: Decision tree showing the VIX rule.]
This rule helps the strategy adapt to the market’s mood. But did this adjustment improve performance?
How Did the VIX-Adjusted Strategy Perform? (2011–2024)
The results?
- Total Return: 496.87% (SPY: 461.81%)
- Average Annual Return: 9.45% (SPY: 9.11%)
- Sharpe Ratio: 0.87 (SPY: 0.83)
- Max Drawdown: -34.16% (SPY: -33.72%)
- Longest Drawdown: 618 days (Original: 842 days)
This version showed stronger returns and shorter slumps. What lessons can we draw from this experiment?
What Can We Learn?
- Markets change. No strategy lasts forever.
- Small adjustments matter. One extra rule improved results.
- Risk management counts. Reducing drawdowns can help you stay in the market longer.
** Notable Metrics:**
Metric               Strategy    S&P 500
-------------------  --------   --------
Cumulative Return   461.81%      496.87%
Yearly (ann.)          9.11%       9.45%
Sharpe                  0.83        0.87
Max Drawdown         -33.72%     -34.16%
Longest DD Days          708         618
Final Thoughts
This isn’t a trading recommendation. Instead, it’s an example of how to build and test strategies using data. Tools like Python let you explore ideas, test them, and improve them.
The lesson is clear: Simple ideas can work—if you test, tweak, and adapt them.
Want the Python code? Here you go:
"""
Implements a seasonal trading strategy combining GLD, SPLV and SPY based on VIX levels.

The strategy:
1. Holds GLD during seasonal periods (Dec 20-Feb 20 and August)
2. Otherwise switches between SPLV and SPY based on VIX levels
"""

import pandas as pd
import numpy as np
import yfinance as yf
import quantstats as qs

# Define ETFs to trade
tickers = ["GLD", "SPLV", "SPY"]

# Download historical data and calculate returns
assets = yf.download(tickers)["Adj Close"].pct_change().dropna()
assets.columns = tickers

# Calculate VIX indicator
vix = yf.download("^VIX")["Adj Close"]
vix = vix.resample('ME').mean()  # Get monthly average VIX
vix.index = vix.index + pd.DateOffset(days=1)  # Align index with trading days
vix = vix.resample('D').ffill()  # Fill missing days with last value
vix = vix.reindex(assets.index)["^VIX"]  # Match VIX index to asset data

# Initialize strategy column
assets["Strategy"] = np.where(vix > 21, "SPLV", "SPY")  # Base allocation on VIX
assets["Strategy"] = np.where(vix > 21, "SPLV", "SPY")  # Repeated for validation

# Implement final strategy rules:
# 1. Hold GLD during seasonal periods (Dec 20-Feb 20 and August)
# 2. Otherwise hold SPY when VIX < 13, SPLV when VIX > 13
assets["Strategy"] = assets["GLD"].where(
    ((assets.index.month == 12) & (assets.index.day >= 20)) |  # December 20 onwards
    ((assets.index.month == 2) & (assets.index.day <= 20))  |  # Until February 20
    (assets.index.month == 8),  # All of August
    np.where(vix > 13, assets["SPY"], assets["SPLV"])  # Non-seasonal allocation
)

# Calculate strategy metrics through 2024
qs.reports.metrics(assets["Strategy"], "SPY")
Updated on 18 February 2025.
For the latest version and comments, please see:
https://aroussi.com/post/the-worlds-laziest-trading-strategy-six-years-later